Despite the external similarities of economic models of two leading developing governments of South-East Asia and differences of their geography, resources and demography, the development of Japan and South Korea during recent years significantly diverge in their outcomes.
Officially, Japan is the 3rd economy of the world on nominal amount of GDP, which, according to the data of World Bank, amounted to $4123 billion in 2015. By more objective index of GDP on purchasing-power parity, this amount is assessed much higher by this institution- $4738 billion, but according to this indicator, Japan is only the fourth biggest economy after India.
Japan’s economy is ipso facto facing long stagnation, which started in 1992. From then onwards, the average growth of GDP amounted to only 0.8%, and during 6 years period of time, Japan had been experiencing economic slowdown. After the last crisis, the situation had become more aggravated- from 2008 to 2015 the average growth amounted to only 0.16%, 4 years from 8 Japanese GDP had declined. If to consider GDP in currency (dollar) calculation, not in yen, then dynamics of Japan’s economy for this period becomes negative, as during the period of 16 years of 2000s (Fig.1).
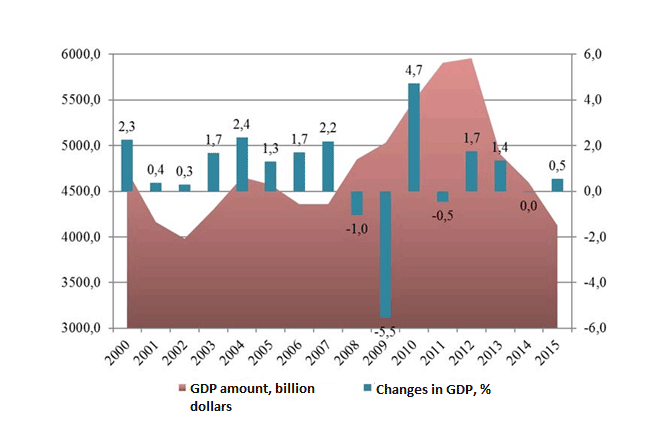 Figure 1. Japan’s GDP dynamics for 2000-2015[1]
Extended period of stagnation and deflation resulted in the start of realization of large-scale program of state support of the economy by Shinzo Abe government, which had been called as “abenomics” in 2012. There had been used non-traditional and disputable methods of monetary nature, directed at overcoming deflation through increasing money stock and devaluation of yen. Injections of money by Japanese Bank to economy were meant to stimulate loan activity of banks and growth of consumption, but devaluation of yen was meant to increase the competitiveness of Japanese goods in the world and expand export and production for external markets.
Initially, some results have been achieved and index numbers for 2013 were better than the stagnation of previous years. However, then macroeconomic dynamics had deteriorated again, and strategy of “abenomics” revealed its ineffectiveness. In quarterly terms for the last 6 years, Japanese economy had experienced 6 declines in GDP, and 5 of them happened exactly during the period of “abenomics”. This economic policy resulted in deepening and worsening the long-standing problems of Japanese economy, above all, it led to sharp increase of government debt -which reached 240% GDP- the level, unprecedented among developed countries.
Today, the prevailing tone in regard to the future of Japanese economy is pessimistic, conditioned as with perspectives of relapsing into another recession, and as with ever-growing concerns with regard to gigantic indebtedness. During the year of 2016 IMF reduced the forecast on the growth of Japanese economy for the years of 2016-2017. If in the beginning of the year, the expected growth rate for 2016 was 1%, then for 2017 it was 0.3%, however, these estimations have been decreased sharply – growth expectations for 2016 had been reduced by half – up to 0.5%, and for 2017 it had turned into recession in the amount of 0.1%. In July, in conjunction with “Brexit”, IMF revised its estimates –now expectations for 2016 suppose the growth of 0.3%, and to be honest, IFM experts seem to expect 2017 to be better, and without decline, but with growth of 0.1%.
Korean economy, on contrary to this, demonstrated high growth rate and is remaining in this trajectory. During the period from 1992 to 2015 Korea’s GDP increased with annual average rate of 5% and even during the period of “Great Recession” from 2008, these rates had remained high, amounting to 3.1%. In contrast to Japan, Korean GDP increase not only in national currency (in won), but also in dollar terms (Fig.2), increasing 2.5 times in 2000s – from 560 up to $1380 billion, which allowed the country go up to 11th place in the world (by the index of GDP on purchasing-power parity South Korea is on 13th place).
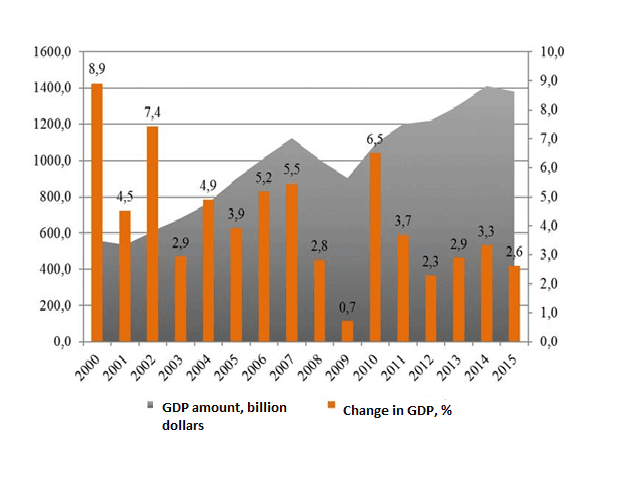 Figure 2. Korea’s GDP dynamics for 2000-2015[2]
Thus, if in 2000, Korea had 10-fold less GDP in comparison to Japan, then in 2015 this discrepancy had reduced up to 2.5 times.
Nowadays future of Korean economy in general is estimated as favorable. Government estimates, even those downward revisions in July, suppose economic growth of 2,8% in 2016 (previous estimation – 3,1%), and in 2017 – up to 3%. Bank of Korea also has an analogous estimates of GDP growth for 2016.
Korean economy, with its high expert orientation, has been affected with the problems in world economy and drastic slowdown of global trade. Because of this, Ministry of Finance has initiated the incentives package with the overall amount of more than 20 trillions of South Korean won ($17 billion), including the increase of government expenditure of 10 trillion won, which would be forwarded for the job creation and for support of regions.
At the same time, stimulus program will be financed not through loans, but through the budget surplus of last year (about 1.2 trillion won) and additional tax revenue of current year which reflects the healthy system of country’s public finances and its ability to create stimuli for development through internal sources in contrast to many developed countries, including Japan, which are induced to resort to loans.
Looking at the problems of development of Japan and Korea, it is important to take into account a significant aspect such as exchange rate from which many things depend upon in export-oriented economies- from the export volumes to the amount of GDP in terms of dollar. In particular, it is clear from Fig.1 on the graph of Japan’s GDP that dollar amount of GDP during the period from 2007 to 2012 initially had significantly risen, and then it declined with equal angularity. These fluctuations were caused by the strong fluctuations of yen rate against dollar. During this period, volatility of currency pair of dollar/yen reached 56%, a little smaller, but also the fluctuations of Korean won had been substantial (36%)(Fig.3).
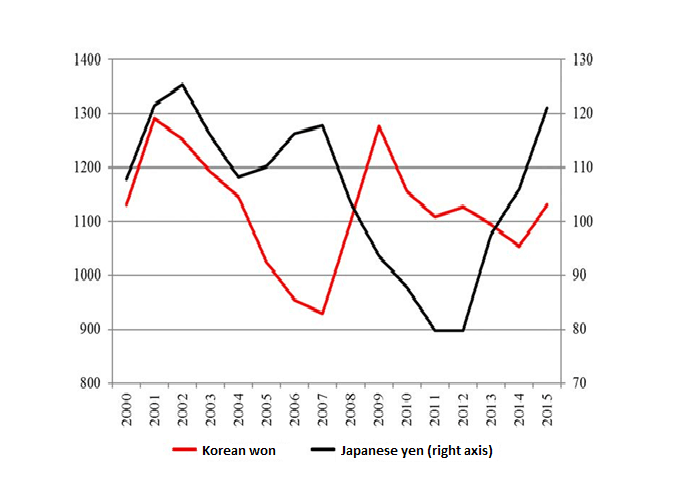 Figure 3. Annual average exchange rate of Japan and Korea in regard to US dollars, unit for a dollar.[3]
It can be seen from Fig.3 that in case with Japan, fast exchange adjustments of yen during the period of 2007-2012 mainly conditioned the growth of dollar equivalent of GDP, as in the case of falling yen during the course of “abenomics” in 2012-2015 called forth the same drastic reduction in dollar amount of GDP. Korean currency, though is differed with its less volatility, had direct influence upon the dollar amount of GDP- its reduction in 2007-2009 was caused not only by the world crisis, but also by won’s fall in the midst of this crisis. In an analogous way, the gradual strengthening of won in 2010-2014 had stimulated the intensive growth of dollar GDP.
One interesting distinction of Japanese economic situation is that despite the devaluation of yen during 2012-2016, the amount of international reserves of the country had been decreasing during this period as well (Fig.4), though usually monetary expansion and national currency devaluation are followed by reserve growth. As in other spheres, the situation in Korea in this case is reverse- reserve growth tendency did not discontinue during last years as well, despite the complex economic situation, as well as in the midst of won’s strengthening.
 Figure 4. Monetary reserve dynamics of Japan and Korea after 2000, billion US dollars.[4]
Monetary dimension of economic policy of these two countries, especially of Japan, has an affect not only on the indicator of dollar equivalent of GDP, but also on other indicators of macroeconomic well-being. At the same time, conventional view of the currency rates to be crucial in the promotion of exports in case with Japan and Korea has an ambiguous expression which could be seen from the graph in Fig.5.
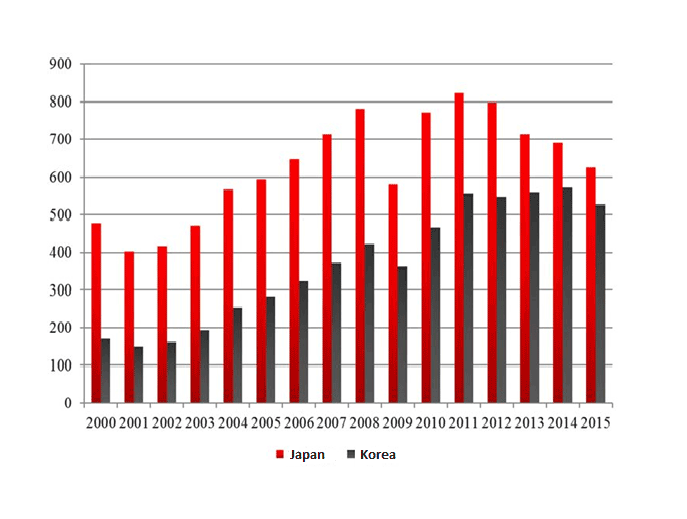 Figure 5. The dynamics of export volume from Japan and Korea in 2000-2015, billion dollars.[5]
The falling of yen rate during the realization of “abenomics” has not led to the growth of Japanese export, vice versa, its amount has been reduced from $823 billion in 2011 to $625 billion in 2015. Certainly, one thing to be taken into account is that export evaluation currency makes such allowances to this index as in abovementioned index of GDP- falling of yen leads to the increase of dollar amount of export, as it happened in 2009-2011.
Nevertheless, Japan’s attempts to stimulate export by the falling rate of national currency turned out to be a failure, which can considerably be noticed in the comparison of dynamics of Japanese and Korean export. Export from South Korea has grown steadily almost throughout this period and drops in won rates, which had also been substantial, did not have significant impact on this process. Won’s exchange rate against dollar in 2015 was little different from the rate of 2000, but exports had risen more than three times during this period. During 16-year period Korea was able to match in its export volume with Japan, although in the beginning Korea was lagging behind Japan three times.
Thus, comparison of Japan’s and Korea’s export dynamics demonstrates that currency rates cannot be the significantly fundamental factor of its acceleration, as well as, it illustrates the fact that Japanese economy has deep-rooted systemic problems, which steadily pushing her out of the world leaders’ list. In 1986, Japan’s share in world export amounted to 9.84%, and export amount surpassed Korean export by 6.1 times, in 1996 Japan’s share got reduced by 7.6%, but disjuncture with Korea- by 3,2 times, in 2006 these indicators amounted to 5.3% and by 2 times, in 2015 – 3.8% and by 1.2 times. Korea’s share in world export, vice versa, increased constantly – from 0.85% in 1980 it rose up to 3.2% in 2015, yet, despite the chronic turbulence of world economy during the last decade, crisis and drop of world trade, Korea progressively expanded its share in world export and has regularly been updating its record on this indicator, and the level of 3.2% in 2015 is also an absolute record for Korea.
The currency rate factor is significant for other important aspect of Japan’s current economy ( and to a lesser extent of Korea) , particularly for the debt problem. During recent years, Japan’s government debt set records on national as well as on international level, whereas situation in Korea is way better. For June of 2016, the overall government debt of Japan amounted to 1053 trillion yen[6] ($10,2 trillion), volume of released treasury obligations of Korea for August – 534 trillion won ($477 billion)[7]. Relative parameters of government debt of two countries also differ radically – Japan’s ratio of government debt and GDP amounts to nearly 240% – unprecedentedly high rate, which ensures doubtful leadership not only among developed countries, but also in contrast to less developed and financially problematic countries. Korea’s ratio is about 35%, level close to the minimum of developed nations.
The problem of Japanese government debt is one of the key for the economy and mostly acts as a cause as well as inevitable way out for many problems. The number of disputed decisions in the sphere of economic policy can be explained not only through the declared intentions of governments in the sphere of economic development, but also through hidden motives directed at the struggles with accelerated growth of the government debt. Japanese government debt was denominated primarily in national currency, because of which rate factor and devaluation of yen led to significant reduction of its dollar amount in 2012-2015, though buildup of debt during this period continued and its amount in yen rose (Fig.6).
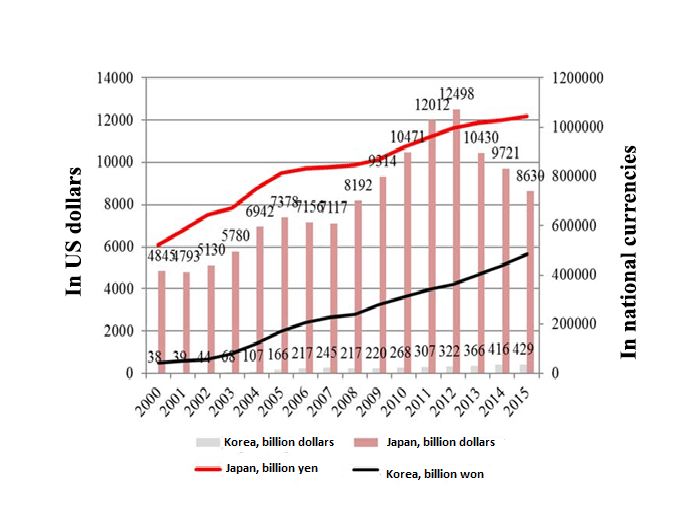 Figure 6. The dynamics of government debt amount of Japan and Korea for 2000-2015 in national currency and US dollar terms, billion.[8]
Consequence of yen’s devaluation was a considerable reduction of dollar equivalent of Japanese government debt – from $12.5 trillion in 2012 to $8.6 trillion in 2015 – which means for 31%. For the purpose of comparison: government debt of South Korea continued to grow in national currency as well as in dollars, and this increase was intensified during recent years in comparison to Japanese indicators, which is quite conceivable taking into account greater safety margin of Korean system of government finances and low level of its indebtedness.
Japanese government debt has indirect affects on the majority of fields of economic sector, as it has been an encumbrance for government finance for long period of time, despite the specification which simplifies its control (practically all the amount is internal, major part belongs to government organs, main holders – finance sector, which is subjected to state regulation and others ).
In spite of very low interest yield, government debt management of current year amounts to 24.4% of expenditure (23.6 trillion yen). At the same time, the revenue structure of Japan’s budget is distinctive – 35.6 % of revenue is formed using bond issuances, which means through building up of debt, tax revenues give only 59.6% (57.6 trillion yen). This means that 42% of tax revenue is spent on government debt management, and management expenditure exceeds revenues from these types of taxes such as corporate income tax (12.2 trillion yen) or individual income tax (18 trillion yen[9]).
In other words, even now, at minimal yield of Japanese government bond, government debt management is a huge problem for government budget. This problem is peculiar of Japanese economy at the end of 1990s. Japan had drastically increased the issuance of government bonds, the share of contributions from issuance which rocketed up to 39-40% in 1998-1999. After this management of fast-increasing government debt required more and more facilities, and the share of government expenditure by this article had become more and more. Crisis of 2008-2009 had contributed to this situation and revenue share from the bond issuance exceeded 52% [10], in other words, most part of the budget was formed using borrowings.
Respectively, there was rise of expenditure on government debt management- from the middle of “zero” year they had been steadily settling on the level of 22-23% from the overall amount of budget expenditure. At the same time, regular sources of budgeting in Japan has been experiencing stagnation for decades. In 2011, the Ministry of Finance marked that tax revenues in financial year of 2011 in the amount of 40.9 trillion yen remain on the level as in 1986. Meanwhile, public debt issuance reached 44,3 trillion yen»[11].
This means that Japanese government budget is experiencing chronic ailment for the period of several decades, tax revenues did not increase, almost half of revenue depends upon government debt, and quarter of expenditure is spent for its management. If the amount of government debt management expenditure on the level of about 20-23% was not something exceptional in Japanese practice- budget with these parameters were performed at the end and at the beginning of 1990s and even in 1980s, then sharp increase of budget dependency on bond issuance became the new phenomenon in the mid and end of 2000s.
To our mind, ambiguous activities in the framework of “abenomics” were mainly caused by the exacerbation of budgeting process. Key element of this program which is “quantitative easing”, functionally similar to American prototype, can be regarded to be directed not only against the deflation (mainly declared goal), and not even devaluation of yen, but stimulation of export and consumption growth using enhancement of lending activities of the bank. This program improved the situation with government debt of Japan to some extent.
This improvement occurred in three main directions. Firstly, as was mentioned above, as a consequence of devaluation of yen, the dollar amount of debt had been reduced significantly. Secondly, Japanese Bank’s asset buyout led to the severe decline of government bond yield- if in the beginning of 2011, the market return of 10-year papers amounted to about 1.25%, then by March of 2016, this had been reduced to zero, and then, for the first time in the history went to negative zone, and practically throughout 2016 remained negative. Respectively, new public bond issuances were carried out with negative return, in other words, money loan for government became for free, what is more, they brought in revenue.
Taking into account the huge amount of accumulated debt, in which the issuances of 2016 have insignificant share, this decline of returns did not have significant effect on the situation with government debt, but as a minimum, these measures taken prevented the escalation of its exponentially growing amount. Furthermore, budgetary expenditures on government debt management in the part of interest payments got reduced to some extent, both in absolute and relative terms for the last five years. In 2011, the amount of interest payment on government debt amounted to 9959 trillion yen, in other words 10.8% of budgetary expenditure[12]. In 2016 these indicators have gone down to 9896 trillion yen and 10.2% of budgetary expenditure[13].
The third direction, where certain progress had been achieved is a significant reduction of new borrowings both in absolute and relative terms. In 2011, the volume of issuance amounted to 44.3 trillion yen, and this source ensured 46.8% of budgetary expenditure, whereas in 2016 the bond issuance amounted to only 34.4 trillion yen, and their share in budget revenue was 35.6%. Since new issuances are mainly aimed at refinancing of existing debt, then namely the reduction in the cost of its management as a consequence of the reductions in revenue, which had been ensured by monetary stimulus, allowed the considerable decrease the issuance of new bonds and thus delay the process of government debt growth which earlier had been hardly controllable.
Therefore, “abenomics” which could not achieve notable success in stimulating economic growth and struggle against deflationary process, for which it is criticized by great number of experts, still has one clear achievement- progress of limiting the growth of government debt, which had been a key issue for Japan during previous decades.
Nevertheless, the achievements of “abenomics” are still remaining limited and in overall are not able to reverse the negative trends in the development of Japanese economy, main chronic problem of which is the stagnation, in other words, extremely slow level of growth or even decline in certain areas including those ones, which were regarded as national locomotives. However, stagnation under contemporary circumstances of fast growth of new industrial economy and other competitors means inevitable reduction of their share, the loss of markets, decrease of influence in the world. For example, the field which traditionally had been associated with Japan, such as the production of automobiles, to the last 18 years not only increased the production in the midst of 2-fond world growth, but even reduced it. In 1997 Japan had produced almost 11 million automobiles of all types, in other words, 21% of world production (51.1 million)[14]. In 2015 Japanese production amounted to 9,278 million automobiles (for 15.5% less), but world – 90.8 million [15], in other words share of Japan in world machine building got reduced to 10.2%, or by 2 times.
Korea, in the same automobile manufacturing, as in other major spheres of industry demonstrates inverse trends and intensively increasing the production, though, this does not ensure the growth of role in world market. In 1997, the country had produced 2.8 million automobiles (5.5% of world quantity), and in 2015 – 4.6 million (5.1%). At increasing the volume of production by 64%, share of Korea in world production had been reduced to some extent.
The illustration of automobile manufacturing is demonstrative of the Japanese economy, which is gradually receding from its position in the world for the last two decades, which is also manifested in the reduction of its share in all key macroindicators of world economy- GDP, trade, industrial production and others. (Fig.7).
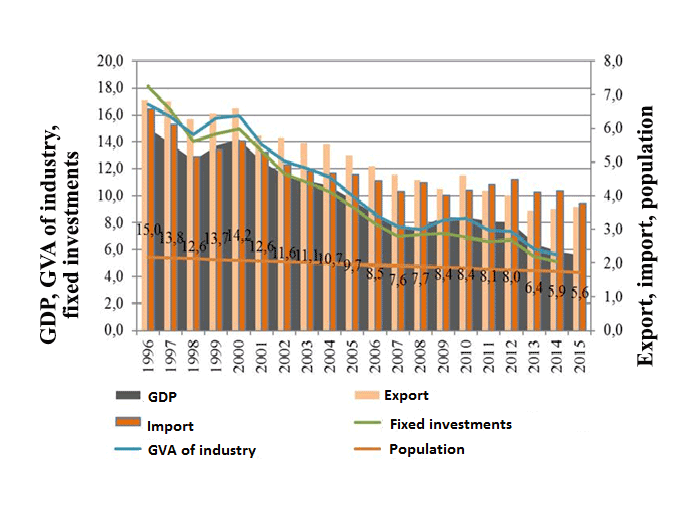 Figure 7. The change of the role of Japan’s economy in the world for last 20 years, share is shown in relative world indicators, %.[16]
Japan’s share in world GDP for these years got reduced by 2.7 times, in world export – by 2 times, in import – by 1.7 times, in value added manufacturing – by 3 times, in fixed investments – by 3.6 times. The last aspect is particularly noteworthy, as fixed investments form the basis for the future of economic potential, and their preemptive decline in Japan in comparison to other indicators show the possibility of further loss of the competitiveness of the country and diminishing of its role in world economy. Apart from that, Japan is steadily reducing the share of world population, which had decreased during 20 years by 1.3 times, what is more, not only relative, but also absolute depopulation is observed during recent years- starting from 2009 Japan’s population has been reducing and for the period of 2008-2015 it got reduced to more than 1 million people .
Situation in Korea on similar indicators is opposite – Korean economy is gradually growing its position in the world, although not very intensive, with varying speed in various areas, and sometimes this process is discontinued. (Fig.8).
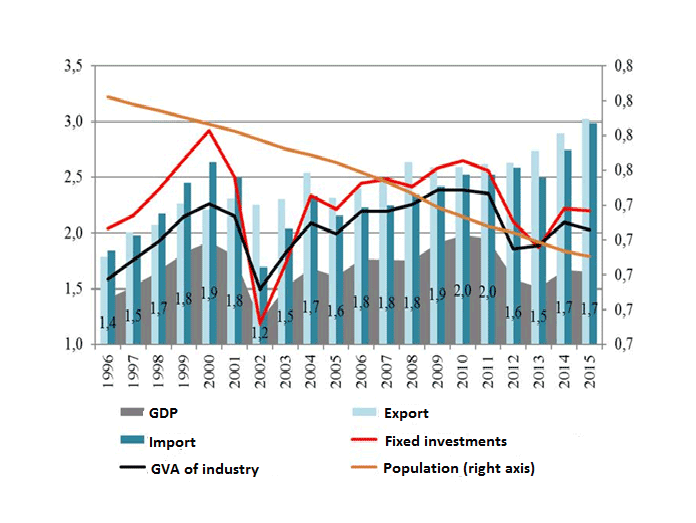 Figure 8. The change of the role of Korea’s economy in the world for last 20 years, share is shown in relative world indicators, %.[17]
Korea had achieved more significant progress in the sphere of internal trade- export increased by 1.7 times, import – by 1.6 times. In other spheres, the growth of share in world indicators was not so noteworthy (10-30%), but under the conditions even when developing countries show growth of indicators, the preservation of one’s share is in itself an achievement for developed economies, even when the growth is not so notable.
However, the growth of Korea’s share in all significant global economic processes occurred (as in Japan) in the midst of its population reduction, and this also means the increase of effectiveness in using human capital. However, unlike Japan, in Korea there is no depopulation and the number of people is growing for the last 20 years, increasing from 43.7 to 50.6 million people.
To summarize the review of current economic situation in Japan and Korea, the following conclusions could be made:
– two countries are developing in opposite directions – Japan is experiencing chronic stagnation, whereas Korea is maintaining vigorous speed of growth under the conditions of consecutive crisis of recent years;
– Japan is steadily losing its position in the world economy in all key spheres of economy, which can be seen in the constant decrease of its share in main macroeconomic parameters of global level;
– Korea, vice versa, is demonstrating the growth of its significance in world economy in an analogous way- growing its share in world GDP, external trade, investments and etc. Korea’s export had almost reached the volume of Japan’s export;
– Japan’s policy of “abenomics”, which encompassed large-scale measures of monetary stimulation, reached insignificant results in those areas, which had been prioritized (economic growth, deflation maintenance), but led to the stabilization of situation with government debt- key problem of Japanese economy;
– future of two countries is assessed in compliance with their current trajectory of development, which has prevailed during previous years- the growth of Japanese economy is expected on the level close to zero, whereas it is expected that Koreas’s GDP would increase by 3%;
–economic cooperation of Japan and of Korea with Kazakhstan has perspectives in the sphere of attracting investments from these countries- Japan is one of world leaders on the amount of investments into foreign countries, ranking 2nd in the world for recent years, however, it is remaining less visible in Kazakhstani market (7th place). However, both Japanese and Korean investments are mainly concentrated not in high-tech or industrial manufacturing, but in other sectors. There is also a reserve for attracting them into the high-processing production.
List of references:
[1] Calculated according to the data from IMF: World Economic Outlook Database. October 2016 Edition. IMF website. URL: http://www.imf.org/external/pubs/ft/weo/2016/02/weodata/index.aspx (дата обращения: 24.10.2016).
[2] Calculated according to the data from IMF: World Economic Outlook Database. October 2016 Edition. IMF website. URL: http://www.imf.org/external/pubs/ft/weo/2016/02/weodata/index.aspx (дата обращения: 24.10.2016).
[3] Calculated according the data from IMF: Exchange Rates selected indicators. Avg. Exchange Rate, NC/US$, Rate// IMF Data. IMF website. URL: http://data.imf.org/?sk=388DFA60-1D26-4ADE-B505-A05A558D9A42 (дата обращения: 24.10.2016).
[4] Total reserves (includes gold, current US$). World Bank Databank. The World Bank website. URL: http://data.worldbank.org/indicator/FI.RES.TOTL.CD?locations=JP&name_desc=true (дата обращения: 25.10.2016.
[5] Calculated according to the data from IMF UNCTAD: Goods and Services (BPM6): Exports and imports of goods and services, annual, 2005-2015// UNCTADStat. United Nations Conference on Trade and Development website. URL: http://unctadstat.unctad.org/wds/TableViewer/tableView.aspx (дата обращения: 30.09.2016).
[6] Central Government Debt(End of September 2011 — present) //Central Government Debt. Ministry of Finance Japan website. URL: http://www.mof.go.jp/english/jgbs/reference/gbb/index.htm (дата обращения: 24.10.2016).
[7] Issues and Outstanding Amounts of Principal Government, Public and Corporate Bonds// Economic Statistics System/ Bank of Korea website. URL: http://ecos.bok.or.kr/flex/EasySearch_e.jsp (дата обращения: 24.10.2016).
[8] Calculated according to the data from Japanese and Korean Banks: National Government Debt// Public Finance// Statistics. Bank of Japan website. URL: http://www.boj.or.jp/en/statistics/public/ngd/index.htm/#p01 (дата обращения: 25.10.2016; Issues and Outstanding Amounts of Principal Government, Public and Corporate Bonds// Economic Statistics System/ Bank of Korea website. URL: http://ecos.bok.or.kr/flex/EasySearch_e.jsp (дата обращения: 24.10.2016).
[9] Japanese Public Finance Fact Sheet. 2016, Ministry of Finance. Ministry of Finance Japan website. URL: http://www.mof.go.jp/english/budget/budget/fy2016/03.pdf
[10] Calculated according to the data from Ministry of Finance of Japan: Summary of Revenues and Expenditures in General Account// Statistics & Data (As of June, 2010). Ministry of Finance. Ministry of Finance Japan website. URL: http://www.mof.go.jp/english/budget/statistics/201006/index.html (дата обращения: 26.10.2016).
[11] Japanese Public Finance Fact Sheet. 2011, Ministry of Finance. Ministry of Finance Japan website. URL: http://www.mof.go.jp/english/budget/budget/fy2011/factsheet.pdf
[12] Japanese Public Finance Fact Sheet. 2011, Ministry of Finance. Ministry of Finance Japan website. URL: http://www.mof.go.jp/english/budget/budget/fy2011/factsheet.pdf
[13] Japanese Public Finance Fact Sheet. 2016, Ministry of Finance. Ministry of Finance Japan website. URL: http://www.mof.go.jp/english/budget/budget/fy2016/03.pdf
[14] WORLD MOTOR VEHICLE PRODUCTION BY COUNTRY 1997-1998// 1998 STATISTICS// OICA Statistics. International Organization of Motor Vehicle Manufacturers website. URL: http://www.oica.net/category/production-statistics/1998-statistics/ (дата обращения: 27.10.2016).
[15] 2015 PRODUCTION STATISTICS// OICA Statistics. International Organization of Motor Vehicle Manufacturers website. URL: http://www.oica.net/category/production-statistics/2015-statistics/ (дата обращения: 27.10.2016).
[16] Calculated according to the data from World Bank: World Development Indicators// World DataBank. The World Bank website. URL: http://databank.worldbank.org/data/reports.aspx?source=world-development-indicators# (дата обращения: 27.10.2016).
[17] Calculated according to the data from World Bank: World Development Indicators// World DataBank. The World Bank website. URL: http://databank.worldbank.org/data/reports.aspx?source=world-development-indicators# (дата обращения: 27.10.2016).